Right now, two companies are set to absorb a massive influx of public capital. OpenAI and Anthropic carry a combined target value near $2 trillion. That’s not a typo. That’s a stress test for the market’s faith in AI.
OpenAI filed its S-1 with the SEC. The target: up to $1 trillion. The reality: the company loses $1.22 for every dollar it earns. Today, we do what the breathless headlines won’t. We read the filing, run the numbers, and build a framework you can use.
Sponsor
On July 4th, the energy market changes.
Solar loses its biggest advantage.
Wind loses its biggest advantage.
But one energy source keeps full government backing for years.
That source is geothermal.
And Dylan Jovine believes this is the moment Wall Street is completely missing.
Because geothermal doesn’t shut off when the sun sets.
It doesn’t wait for the wind to blow.
It doesn’t burn fuel.
And it can run 24 hours a day — exactly what AI data centers need.
One company has spent decades building the infrastructure, technology, and power plants behind this resource.
And once the July 4th shift hits, this “sleepy” energy stock may not stay sleepy for long.
Get the ticker before the July 4th energy shift >> (Si apre in una nuova finestra)
The Filing — What OpenAI Actually Said (and Didn't Say)
Let’s start with what happened. On June 8, OpenAI confirmed it had quietly sent its S-1 to the SEC. Goldman Sachs and Morgan Stanley are the lead banks. The target window is as early as September 2026. The value ceiling: $1 trillion.
Here’s the company’s own words:
“We have not decided on timing yet; it may be a while because there are things we want to do that are likely easier as a private company.”
Read that again. The company filing to go public is also saying it might prefer to stay private. That’s not confidence. That’s hedging.
The Private Market Baseline
OpenAI’s last private round closed in March 2026 at $840 billion. Backers included SoftBank, Amazon, and Nvidia. The total raise was $110 billion. A planned tender offer will let staff sell shares at the $852 billion mark. This eases internal cash pressure.
So the value ladder looks like this:
$840B (March 2026 private round) → $1T (IPO target ceiling) → $1.5T+ (prediction market guesses)
That’s roughly a 19% jump from the last private round to the IPO target. In normal markets, that’s modest. But this isn’t a normal company.
The Revenue-Loss Problem
Here’s the number that should anchor every talk about this IPO. Per the S-1 review by OpenTools, OpenAI loses $1.22 for every dollar of revenue.
Let me map that out:
$1.00 Revenue In → $2.22 Total Cost Out → –$1.22 Net Loss Per Dollar
That’s not a rounding error. That’s a deep, built-in gap. The company spends more than double what it earns.
For context: when Amazon went public in 1997, it lost about $0.30 per dollar of revenue. OpenAI’s burn rate is four times worse. Its target value is roughly 1,000 times higher. CFO Sarah Friar told CNBC in April that IPO prep was “good hygiene” for a company of this scale. She gave no firm date. Good hygiene is what you say when the basics aren’t ready for a checkup.
What the S-1 Doesn’t Tell You Yet
The filing is still private. We lack the full details. Key unknowns include:
Total share count and price range — not shared
Cost split between compute, research, and overhead — not public
Customer mix — how much revenue comes from Microsoft vs. API users
Compute contracts — likely huge, likely multi-year
Until the S-1 goes public, we’re working with a partial X-ray. But even that partial view shows a frame that doesn’t match a trillion-dollar price tag.
The Bank Signal
Goldman Sachs and Morgan Stanley are leading. When the same Wall Street powerhouses stack multiple mega-cap tech listings into the exact same window, they’re running an aggressive pipeline. But pipelines have structural limits.
OpenAI and Anthropic are rushing to look for the exact same class of big-fund buyers within weeks of each other. Capital fields will be tightly contested as they cross the exact same buyer base in one quarter. The last time anything close happened was Q1 2000. I was a junior analyst then. The champagne was great. The hangover lasted three years.
Your Checklist Before the S-1 Goes Public:
Gross margin trend — Is compute cost per query falling quarter over quarter?
Revenue mix — What share comes from one customer (likely Microsoft)?
Deferred revenue — Are big contracts front-loaded or recurring?
Stock-based pay — What’s the dilution path after the IPO?
Capital spending locks — How much is tied up in data center leases?
Anthropic's Parallel Track — The $965 Billion Shadow IPO
OpenAI isn’t filing alone. Anthropic, the maker of Claude, runs a nearly identical playbook on a nearly identical timeline. The numbers are just as bold.
On May 28, Anthropic closed a $65 billion Series H round. Post-money value: $965 billion. On June 1, it confirmed a quiet S-1 draft sent to the SEC. Listing details — share count, price range, exchange — remain unknown. Let’s put these two side by side.
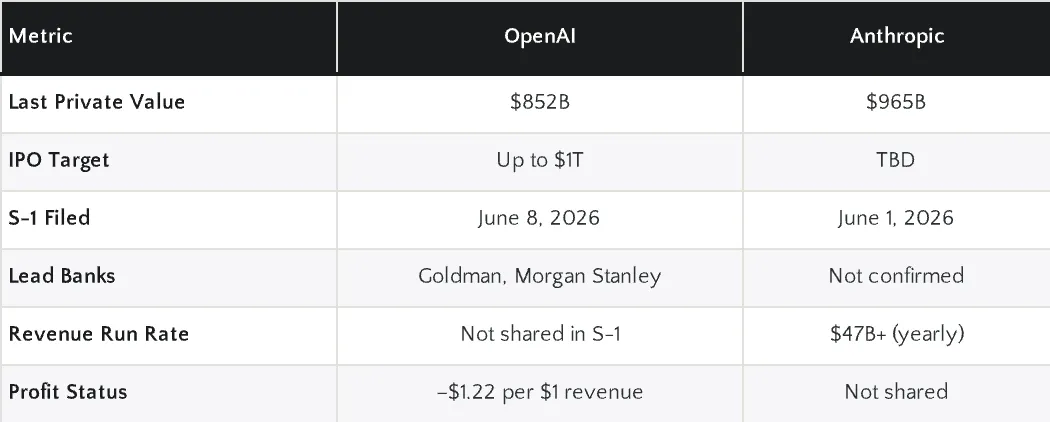
Looking at this data matrix, the consensus narrative cracks: Anthropic actually filed first. Its stated revenue run rate — over $47 billion per year — gives us something OpenAI hasn’t: a top-line number to work with.
The Claude 5 Factor
Here’s where it gets fun. Prediction markets now take bets on whether Claude 5 will ship before June 30, 2026. There’s no official word, no product page, no model card. But traders already price in a near-term launch.
Why does this matter for the IPO? Anthropic’s value story rests on how fast it ships products. A Claude 5 launch during the IPO roadshow would be a strong signal. It would prove the R&D spend is turning into real product:
Claude 5 Launch → Product Signal → IPO Roadshow Boost → Higher Price
Without Claude 5, Anthropic asks public buyers to pay $965 billion for models already on the market (Claude 3.5, Claude 4). With Claude 5, they’re selling the future. The gap could be hundreds of billions in market cap.
But here’s the irony. The prediction market prices in a product that doesn’t officially exist. We’re watching traders bet on a rumor to justify a value for a company that hasn’t shown its losses. Layers of guesswork, stacked like a Jenga tower.
The Dual-Filing Problem
Both companies filing within a week creates a head-to-head that neither wants. When two rivals go public at once, big funds build comparison models. They ask: Which company has better unit costs? Which has a stronger moat? Which relies less on a single customer? Which team has a clearer path to profit?
Right now, we can’t answer most of these. The S-1s are private. But when they go public, the comparison will be harsh. One company will be the “value” pick. The other becomes the “growth” pick. The market will sort them. It always does.
What Anthropic's $47B Run Rate Really Means
Let’s do quick math. If Anthropic earns over $47 billion per year and is valued at $965 billion, we get a price-to-sales (P/S) ratio of roughly 20.5x: $965B Value ÷ $47B Revenue = ~20.5x P/S
For context: Nvidia trades at roughly 25x trailing revenue. Microsoft sits around 13x. Snowflake, the poster child for high SaaS multiples, trades at about 18x.
So Anthropic’s private value already sits above Snowflake but below Nvidia. The question: does an AI model company deserve a chip-like multiple or a software-like multiple?
The answer hinges on margins — which we don’t have:
Margin Type Sets the Multiple → Hardware margins (~60%) support 20x+ → Software margins (~75%) support 25x+ → Unknown margins support caution
Until Anthropic shows its cost structure, the 20.5x multiple is a trust exercise. Trust exercises are fine at team retreats. They’re costly in public markets.
The Value Framework — How to Price a Company With No Profits
Let’s be honest about the core problem. You can’t use standard earnings-based methods for OpenAI or Anthropic. There are no earnings. There are anti-earnings. So what do you use? Here’s a framework I’ve built since the 2021 SPAC wave. It’s not perfect. But it beats vibes.
Step 1: Revenue Multiple Comparison
Start with price-to-sales. It’s rough, but it’s the only ratio that works when profits don’t exist. Let’s view the baseline peer landscape:
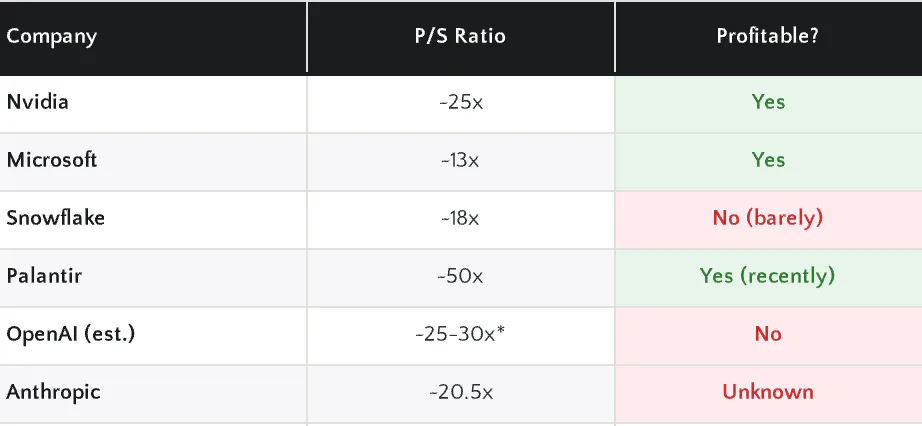
OpenAI’s P/S is a guess since revenue isn’t in the S-1 yet. Reports point to a run rate that lands here at the $1T target. The table shows something key. OpenAI at $1 trillion needs a P/S in Nvidia range. But Nvidia has 55%+ net margins. OpenAI has negative margins. That’s not a small detail. That’s the whole story.
Step 2: Burn Rate Runway
How long can the company last at its current loss rate before needing more cash? This question splits a real IPO from a cash bonfire.
OpenAI raised $110 billion in March. Applying their verified burn mechanics against a projected $30–40 billion run rate means yearly net losses could top $35–50 billion:
$110B Cash Raised → $35–50B Yearly Net Loss (est.) → 2–3 Year Runway Without More Capital
That runway assumes no revenue growth and no cost cuts. Both will likely improve. But it also assumes no rise in compute spending. That’s almost sure to climb as model training scales up. The IPO itself is partly a cash raise. Reports say OpenAI targets $60 billion or more in IPO proceeds. That extends the runway. But it also means public buyers fund the burn:
IPO Proceeds ($60B+) → Fund Losses → Buy Time for Margin Gains → Revenue Must Scale Faster Than Costs
This is the core bet. You’re not buying profits. You’re buying time. The question: is that time worth $1 trillion?
Step 3: The Deep Infrastructure Margin Wall
Every money-losing tech monopoly in history eventually justified its premium by hitting a margin inflection point. Amazon achieved it via AWS scale; Salesforce did it by standardizing cloud architectures. For OpenAI and Anthropic, this turning point is fundamentally different and heavily gatekept.
The burn isn’t just about buying more Nvidia GPUs. The real margin killer hiding under the hood is the training data ceiling and cluster networking architecture. As public internet data degrades into an AI-generated feedback loop, these labs are burning exponential amounts of capital on building complex synthetic data environments. Furthermore, scaling these models has shifted the cost bottleneck from pure compute to massive networking gridlocks—specifically the brutal pricing premium of proprietary InfiniBand clusters versus emerging open-source Ultra Ethernet pipelines.
When you read the public S-1 reports later this year, ignore the user growth charts. Look directly at the infrastructure deployment costs. If their data generation and networking costs are scaling faster than corporate API seat licenses, the turning point is a mathematical mirage.
Step 4: The “What If I’m Wrong” Case
This is the step most investors skip. Build the downside case clearly: What if query costs stall because model size grows faster than chips improve? What if Microsoft, OpenAI’s biggest partner, builds rival models in-house? What if new rules in the EU or US limit AI use, shrinking the market? What if the IPO prices at $1T and drops 30% in six months — like many 2021 IPOs did? A 30% drop from $1 trillion is $300 billion gone. That’s roughly Denmark’s GDP. Wiped out.
Your Tool: The Pre-IPO Eval Sheet
Here are the key baseline inputs to map out before any allocation:
Cell A1: Target IPO value (e.g., $1T)
Cell B1: Estimated yearly revenue (from S-1 when public)
Cell C1:
=A1/B1(Implied P/S multiple)Cell D1: Average P/S of similar companies (from the table above)
Cell E1:
=C1/D1(Peer premium ratio — above 1.5x is a clear red flag)
If E1 tops 1.5, you’re paying a 50%+ premium to peers. That premium needs a clear operational reason. “AI is the future” is not a reason. A proven margin trend is.
What This Means for Your Portfolio — And What I’m Doing
Let me be direct. I am not buying OpenAI or Anthropic at IPO. Not because I think AI is overhyped. I don’t. I think AI infrastructure is one of the most important economic shifts in decades. But I think the pricing runs ahead of the basics by at least 18 months. Here’s my logic, fully open as always.
The Pattern in History
Every major tech IPO wave follows the same arc. First movers price high. Big funds chase. Retail buyers pile in during week one. Then reality lands with the first earnings report as a public company.
2012: Facebook IPO at $104B → dropped 50% in four months → took two years to recover
2019: Uber IPO at $82B → dropped 35% in six months → took three years to recover
2021: Rivian IPO at $66B → dropped 80% in twelve months → still below IPO price
The pattern isn’t “IPOs always fail.” The pattern is: IPOs often overshoot, then correct, then reward patient buyers:
IPO Price → First Earnings Check → Correction (often 20–40%) → Leveling Off → Long-Term Path Gets Clear
The Passive Indexing Distortion
There is a new, dangerous layer to this execution cycle that didn’t exist in 1997 or 2012: The Passive Indexing Feedback Loop. Due to their sheer systemic scale, if OpenAI and Anthropic list at a combined $2 trillion, standard market-cap-weighted index machinery (like SPY and VOO) will be structurally forced to purchase tens of billions of dollars of these shares regardless of their negative cash flows.
This automated, price-insensitive buying will artificially prop up the valuation for quarters, creating a massive divergence between mechanical index demand and true operational value. Don’t mistake forced programmatic inflows for organic market validation.
My Execution Blueprint
My plan: wait for the first two quarterly reports as a public company. That gives me real data. Actual revenue growth. Actual cost structure. Actual margin trend. The cost of waiting is missing the first 20% upside. The gain is dodging the first 30% drop. I’ll take that trade.
Where I Am Putting Capital Instead
If you believe in AI — and the data backs AI infrastructure — then the supply chain is where the safety margin lives today.
Nvidia: Profitable, dominant, and gains from every AI company’s compute spend
TSMC: Makes the chips that power every model from every AI company
Data center REITs: Physical buildings with long leases and steady cash flows
These are the picks and shovels. They make money whether OpenAI or Anthropic wins the model race. They make money even if both companies burn through their cash.
AI Model Company Risk → Binary (margins improve or they don’t) AI Infrastructure Risk → Spread out (gains from total AI spend no matter who wins)
Kira’s Tracker Update
OpenAI IPO: No buy planned. Watching for Q1 2027 entry if a post-IPO dip shows up.
If I’m wrong — if OpenAI prices at $1T and runs straight to $1.5T — I’ll miss that gain. I’ll note it openly. That’s how this works. Transparency isn’t just a brand value. It’s a risk tool. When you write down your logic in advance, you can audit your mistakes later.
The Bottom Line — The Liquidity Reality Check
Let’s strip away the Silicon Valley echo chamber and look at the raw mechanics of the next 180 days.
The immediate risk to your portfolio isn’t that LLMs will suddenly stop scaling or that Claude 5 is a myth. The real threat is a massive institutional liquidity vacuum. When roughly $2 trillion in premium-priced, aggressive equity attempts to squeeze through the exact same public market pipeline in a single quarter, something has to snap. Major investment funds will not magically print new capital; they will be forced to liquidate existing tech gains to fund these massive allocations.
These back-to-back S-1 filings don’t signal a triumphant technological expansion. They signal an urgent, systemic capital call. The frontier AI labs are burning cash at a run rate that private venture networks can no longer sustain, forcing them to offload the compounding hyper-CapEx risk onto public balance sheets.
The structural play is clear: Let the hype machinery and forced index-tracking algorithms run their course in week one. Do not mistake programmatic, price-insensitive inflows for organic market validation. True risk management means letting the retail crowd fund the initial $1 trillion ceiling, while you wait for the footnotes to turn into real, unvarnished quarterly earnings reports.
Read the filings, lock your 35% cash buffer into risk-free yields, and let the machinery find its floor before you deploy a single dollar.
Feedback Loop: Rate Today’s Ledger
We strip away the hype to focus purely on market plumbing and capital flows, but we want to ensure our analytical depth matches your portfolio needs.
Hit reply to this email right now and type a single number (1, 2, 3, or 4) to share your rating:
1 — Highly valuable: This level of structural macro analysis is exactly why I subscribe.
2 — Informative, but needs more execution: Strong perspective, but I want to see specific tickers or tactical setups included next time.
3 — Disagree with the premise: The breakdown feels overly pessimistic and underestimates the long-term strategic monopoly of the asset.
4 — Solid read: A well-balanced perspective to chew on. Keeping a cool head and waiting for the next drop.
Want to expand on your vote?
Don't stop at just a number. If you have a counter-thesis, a specific question, or want to challenge our logic, type it directly into your reply. We read every single response, and the sharpest macro insights from our community will be featured and deconstructed in our next brief.
Data
15/06/2026